Reporting
Get clear insights into your project health and team performance. Gennie's reporting engine creates beautiful, actionable visualizations that help you make better business decisions with confidence.
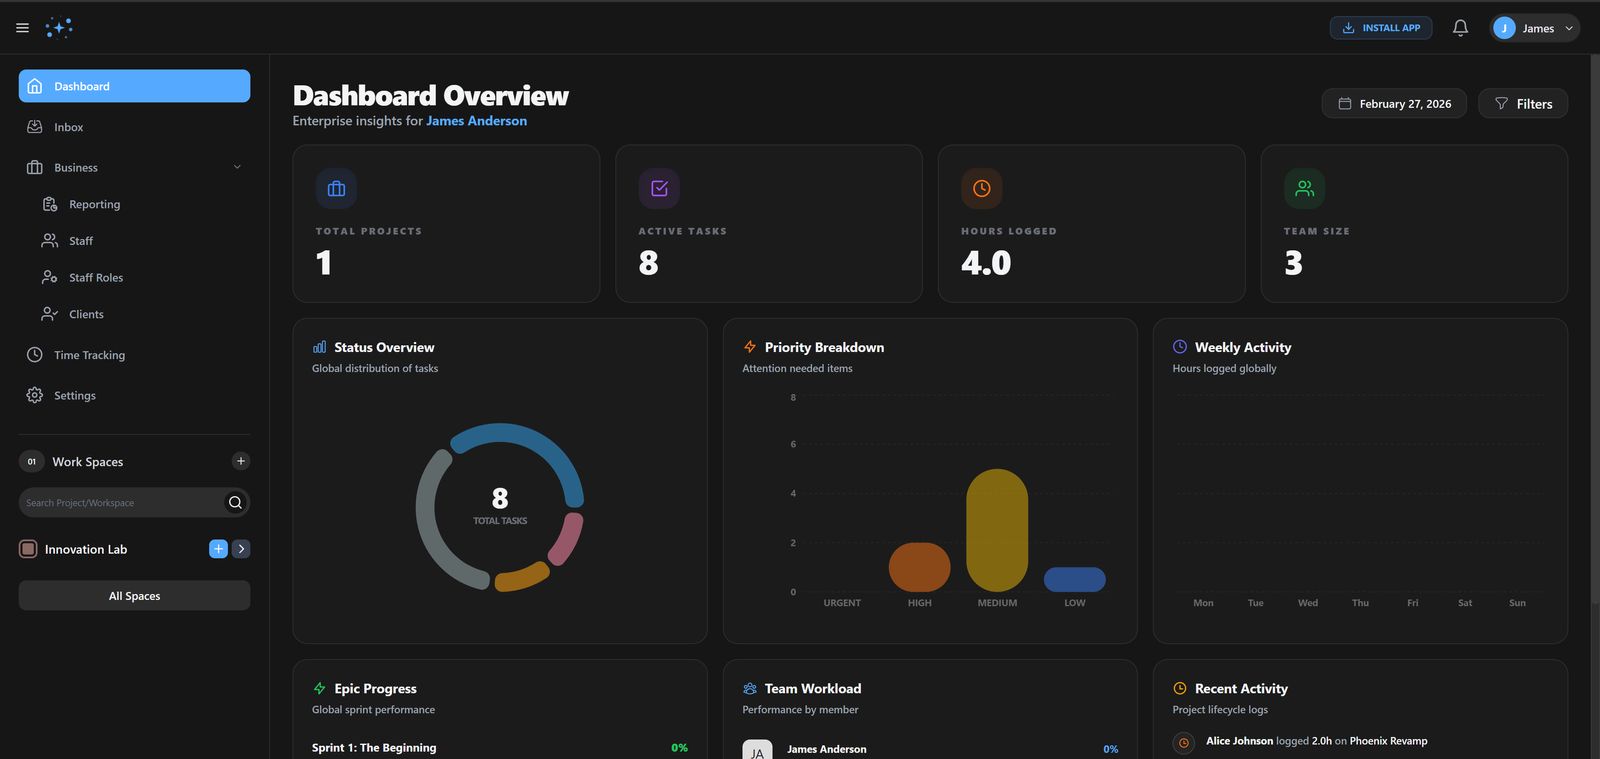
Live Dashboards
Monitor your KPIs in real-time. Our interactive dashboards allow you to drill down into the specifics of any project or team member's performance.
Crystal Clear Insights
Stop squinting at rows of data. Our beautiful visualizations make it easy to see exactly where your project stands and where it's going.
Gennie vs. Legacy Tools
Why high-performing teams are making the switch.
| Capability | Gennie | Alternative |
|---|---|---|
| Dashboards | Interactive/Live | Static Images |
| Permissions | Granular Access | See All/None |
| Delivery | Auto-Email | Manual Send |
Built for elite teams
Engineered to eliminate friction and accelerate delivery.
Data-Driven Decisions
Spot trends, identify bottlenecks, and optimize workflows with actionable insights from your data.
Save Time
Automated reports land in your inbox on schedule. No more manual data gathering or spreadsheet updates.
Impress Stakeholders
Beautiful, professional reports showcase project health and team performance at a glance.
Common Questions
Find answers to frequently asked questions about Reporting.
Ready to ship
faster?
Join 1,000+ teams using Gennie to build the future. Zero setup cost, zero credit card required.